

Why do African farmers face higher fertilizer prices compared to the rest of the world?
15 October 2026 by Arthur Khomotso Mahuma [PDF version available here]
Low fertilizer application has serious implications in sub-Saharan Africa. Farmers produce less than their potential yields and, with 20% of the population facing food insecurity, this is a serious concern (FAO et al., 2026).
While fertilizer usage worldwide averages 139 kg per hectare, in sub-Saharan African fertilizer averages only 22 kg per hectare. It is also significantly lower than in East Asia and the Pacific where the average usage is 278kg per hectare (Ragasa et al., 2025). And, because fertilizer is used more intensively in commercial crops, such as sugar and tobacco, the shortfall in fertilizer usage is even greater for crops farmed by smallholders such as maize, that feed domestic markets (Mahuma et al., 2024).
While many factors drive low fertilizer usage in sub-Saharan Africa, high prices are key and a significant constrain for many smallholder farmers who have limited resources to purchase fertilizer. Focusing specifically on the East and Southern Africa (ESA) region, it is evident that these high fertilizer prices are the consequence of highly concentrated markets that rely on imported fertilizers supplied by a limited number of companies.
This assessment is based on two findings. First, fertilizer prices do not reflect the import parity price, with prices in the ESA region more than double international benchmark prices. Second, the region likely faces an asymmetric price transmission given that prices in the ESA region do not track with worldwide price trends. These two findings indicate significant competition concerns requiring action.
An oligopolistic fertilizer supply chain
Fertilizer offers important nutrients to enrich soil. Nitrogen (N) is the most important element, which can be supplied directly, such as urea or calcium ammonium nitrate, or as compounds in combination with potassium (K) or phosphate (P), as well as in blends like di-ammonium phosphate (DAP) or NPK mixtures.
The production of nitrogen fertilizer is energy intensive. Because it requires the chemical conversion of nitrogen into nitrogen compounds such as ammonia, large-scale production is generally located in areas with abundant natural gas such as in the Middle East, Russia, and Norway. These countries are the main producers of nitrogenous fertilizer in the world and export to the East and Southern Africa region (Roberts et al., 2023).
In East and Southern Africa, the import of fertilizer is handled by international traders who have the capacity to organize bulk shipment from producers around the world (Figure 1). While it is possible to import smaller volumes that are already bagged and packed into containers, costs are higher. Upon arrival in ports (typically Mombasa, Dar es Salaam, Beira, and Durban), fertilizer is offloaded, stored, and bagged in mechanized facilities. At this stage, major suppliers may also blend fertilizers. It is then ready to be transported overland for distribution to the various countries (Roberts et al., 2023).
The primary fertilizer producers supplying East and Southern Africa are vertically integrated from the wholesale import to the distribution at the national and local levels, generally through agro-dealers and sales to large commercial farmers and governments via their fertilizer subsidy programmes. Along with other large international traders and importers, these are the main suppliers to ESA region (Figure 1).
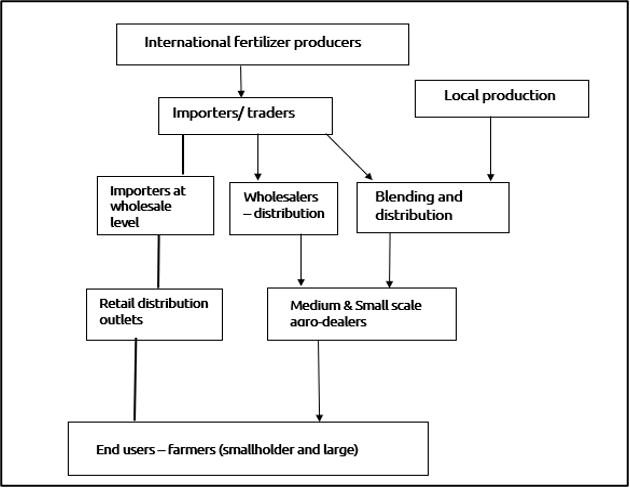
Figure 1. Fertilizer supply chain
Source: Mahuma et al., (2024)
There is little primary production of fertilizer in the East and Southern Africa (ESA) region. South Africa is an exception although it relies on imported fertilizer for 80% of its requirements as well as all of the urea used in its fertilizer production (Competition Commission of South Africa, 2025). The ESA region depends on global importers supplying global markets for its fertilizer supply. However, these global fertilizer markets are oligopolistic with regulators having uncovered anti-competitive conduct, including cartels (Jenny, 2012). Within the ESA region, the fertilizer markets are oligopolistic in nature with just two to five large suppliers able to source internationally in bulk and able to offer bagging and warehousing facilities at the main ports (Roberts et al., 2023). South Africa’s market structure is slightly less concentrated with some local production and a few additional importers.
Regional fertilizers prices decoupled from import parity prices
Under effective competition conditions, prices will reflect supply, which includes the total cost of production, and demand. In situations where countries are net importers of a given product, prices will be determined by imports as well as the addition of transport and related costs (such as warehousing, retail costs and margins). This is known as the import parity price.
Take the example of urea which is imported by all countries in the East and Southern Africa. Fertilizer prices should mirror the international price of urea prices plus the addition of transport costs, wholesale and retail margins as well as other related costs. However, this is not the case. Instead, urea prices have in some cases been more than double international urea prices as evidenced in Kenya, Malawi and Uganda.
Box 1. Regulating the price of fertilizer
Fertilizer prices in South Africa, Kenya, Uganda, Zimbabwe and Malawi are not regulated. Given the reliance on imported fertilizer, this means that prices should reflect world urea prices plus the addition of transport costs, wholesale and retail margins as well as other related costs.
Prices in Tanzania are regulated by the Tanzania Fertilizer Regulatory Authority (TFRA). It sets the maximum prices based on a cost-build up for each type of fertilizer. These prices differ between given the cost of transport (Michelson et al., 2024). As a result, prices in Tanzania are relatively more stable as changes are only made where there are significant changes in world prices.
In can be expected that the price of urea between world Free On Board (FOB) prices[1] and retail prices in the selected ESA countries will differ to take into account costs such as importing, inland transport, estimated at around US$175/Mt, as well as wholesale and retail margins[2]. However, between January 2024 and July 2026, urea prices in these countries were significantly higher by than world FOB prices as illustrated in Figure 2.
For example, while the world FOB price stood at US$375/Mt in October 2024, retail prices in Malawi and Uganda were more than double, reaching US$1,131/Mt and US$940/Mt respectively.
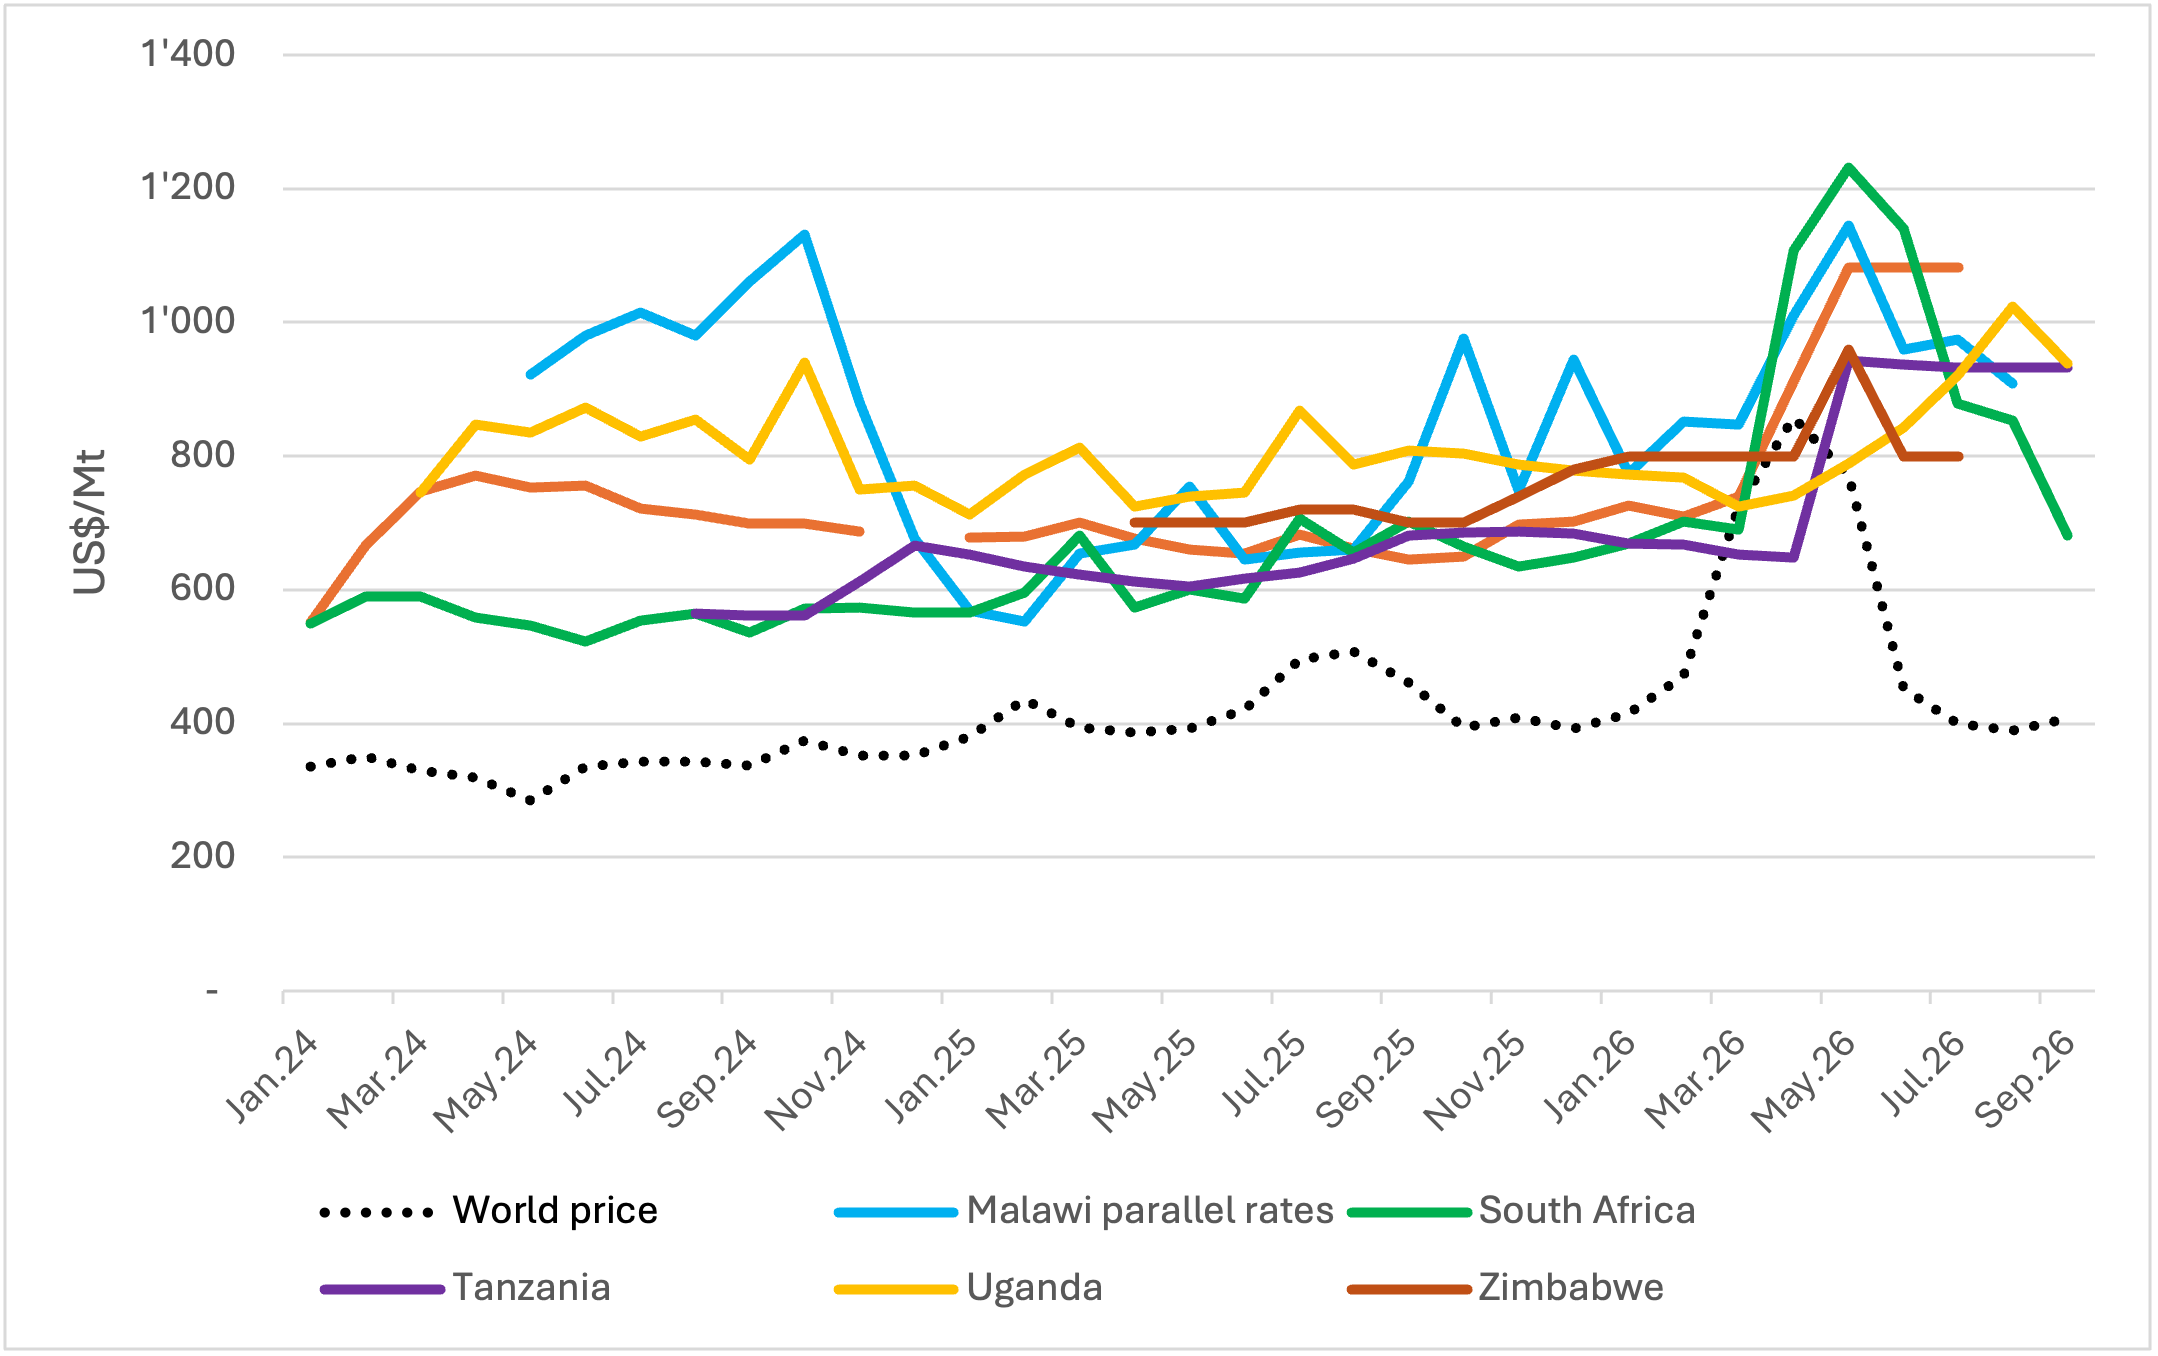
ESA Fertilizer prices surpass global benchmark prices
Figure 2: Urea prices, US$ per Mt
Source: AMO own calculations based on multiple sources; World Bank (Eastern Europe price); Grain SA (South Africa. Tanzania regulator (last price adjustment in May 2026 - other changes are forex related).
Asymmetric price response indicates market power
Prices rise quickly like a rocket but decrease slowly down like a feather. Asymmetric price responses, also referred to as ‘rockets and feathers,’ indicates a negative reciprocal relationship between the increase and decrease of commodity prices at the different levels of the value chain.
Asymmetric price responses are of a particular concern given that retail prices tend to increase at the same rate as bulk prices (in this case, world FOB prices) but do not reduce as quickly. This is clearly illustrated in Figure 2.
While urea retail prices in the focus countries followed the same upward trend as world FOB prices, increasing from US$472/Mt in February 2026 and peaking at US$857/Mt in April 2026 following the closure of the Strait of Hormuz, prices did not follow the worldwide downward trend. Instead, when world FOB prices decreased to pre-closure levels in July 2026, retail prices in the focus countries remained elevated.[3]
Asymmetric price changes are made possible by adjustment costs and market power (Gauthier & Zapata, 2011). This indicates ineffective competition. Under effective competition conditions, cost reduction at any level of the value chain will be fully passed down to consumers as part of the competitive process to gain market shares. However, the situation in the focus countries suggests possible competition concerns given that urea retail prices remained elevated despite a decrease in world FOB prices.
Significant competition concerns
If the fertilizer market worked well in East and Southern Africa, the retail urea prices should reflect import parity prices and not demonstrate an asymmetric price response. This has not been the case. Rather, because retail prices in some countries in the region were significantly higher than import parity prices between January 2024 and July 2026 and did not trend alongside the worldwide cost reduction, indicates ineffective competition between the main suppliers and a highly concentrated market structure.
To help make fertilizer prices more affordable, the countries examined in this article, apart from South Africa, have offered subsidies to farmers. However, competition enforcement can also achieve a reduction in fertilizer prices but without ongoing fiscal support. Competition enforcement requires action from competition authorities. It is therefore essential to provide competition authorities with the necessary technical support and knowledge base to effectively enforce competition laws and policies.
As fertilizer procurement begins in the East and Southern African region in preparation for the next planting and harvesting seasons, high prices will impact fertilizer usage by farmers. It can be expected that lower application rates, resulting in lower harvests, combined with the consequences of El Niño will threaten food security in the region already facing acute food shortages.
[1] World prices are known as Free on Board (FOB) bulk prices and quoted in US dollars (US$). The prices in selected ESA countries are retail urea prices from agro dealers quoted in local currencies and converted to US$ using official rates. This is not the case in Malawi where local prices have been converted using parallel exchange rates from November 2024 given that the country has faced acute shortages of foreign currencies leading to a parallel exchange rate market.
[2] TFRA wholesale and retail margin is 12%
[3] It should be note that the US FTC or Justice department opened an investigation into the price of fertilizer. This may have had an impact in the decrease in fertilizer prices in the United States.
References
African Market Observatory Price Tracker.
Aluoch, S.O., Raseduzzaman, M., Li, X., Li, Z., Bizimana, F., Yawen, Z., Mosongo, P.S., Mburu, D.M., Waweru, G., Dong, W. and Hu, C. (2025). Combined mineral and organic fertilizer application enhances soil organic carbon and maize yield in semi-arid Kenya: A DNDC model-based prediction. Agronomy, 15(2), p.346.
Competition Commission of South Africa. (2025). Fresh produce market inquiry: final report. Pretoria: Competition Commission of South Africa.
FAO, IFAD, UNICEF, WFP and WHO. (2026). The State of Food Security and Nutrition in the World 2026 – Understanding and addressing the high cost of a healthy diet. Rome: FAO.
Gauthier, W.M. and Zapata, H.O. (2011). Testing symmetry in price transmission models. Southwestern Economic Review, 33, pp.121-136.
Meyer, J. and von Cramon‐Taubadel, S., 2004. Asymmetric price transmission: a survey. Journal of agricultural economics, 55(3), pp.581-611.
Jenny, F. (2006). Cartels and Collusion in Developing Countries: Lessons from Empirical Evidence. World Competition, 29(1), 109-136.
Kiwia, A., Kimani, D., Harawa, R., Jama, B. and Sileshi, G.W. (2022). Fertiliser use efficiency, production risks and profitability of maize on smallholder farms in East Africa. Experimental Agriculture, 58, p.e22.
Mahuma, A., Landani, N. and Roberts, S. (2024). The state of competition in Tanzania’s fertilizer markets. CCRED (AMO) Working Paper Series 2024/02.
Michelson, H., Maertens, A. and Magomba, C. (2024). Restoring Trust: Evidence from the Fertiliser Market in Tanzania. PEDL: Working Paper, GRP.
Ragasa, C., Takeshima, H., Asante, S., Amare, M., Ma, N., Olanrewaju, O. and Duchoslav, J. (2025). Maize yield responsiveness and profitability of fertilizer: New survey evidence from six African countries. Food Policy, 133, p.102815.
Roberts, S., Shedi, O., Tausha, I., Kaonga, K., Nsomba, G., Tshabalala, N. (2023). Competition, concentration, and market outcomes in fertiliser markets in East and Southern Africa. CCRED (AMO) Working Paper Series 2023/15.